Many modules were updated to specially support iOS 12 including those below. Many were already available on iOS 12 (Powerlog, Passes, SMS, etc) without a jailbreak. As always, let me know if I missed something! Remember the ‘yolo’ option can always be used to attempt to get those entries if official support in the module has not been added.
Routined - Looks like Apple changed the database schema to change/remove much of the location reverse geolocation protobuf BLOBs that were in the Cache.sqlite, Local.sqlite, Cloud.sqlite databases. Queries have been updated to account for this.
Still working on a few other queries like Screen Time as well as a few more programatic updates.
Just got back from a wonderful time hanging out with the who’s who of Mac security folk in swanky Monaco at the Objective by the Sea conference. I’ve uploaded my presentation Watching the Watchers in my Resources section. This presentation goes through some of the forensically useful artifacts of the following 3rd party monitoring software:
I cannot recommend enough that the OBTS conference is absolutely worth going to if you are at all involved in Apple Security. Next one is ~Q1 2020 and back in Maui!
I had the wonderful opportunity to present this presentation at two great conferences in October; Jailbreak Security Summit and BSides NoLA. Unfortunately I was going on an extended vacation almost immediately after so I forgot to post this to the site. I had a strict self imposed no-laptop policy for this vacation so it would just have to wait. FWIW: Everyone should take a vacation that is [mostly] offline, very refreshing!
The presentation is here, and the video of the presentation from the Jailbreak summit is here. Both of these links are also available in the Resources section of this website.
While I was off exploring Southeast Asia (see my twitter feed for those updates), there has been some major updates to iOS Jailbreaking that are worth a mention with this posting. The Checkm8 exploit was one of the major points of discussion during this presentation, as it was going to be a game changer for this type of analysis.
While I was drinking fruity drinks with umbrellas in them, the public jailbreak came out - Checkra1n. I almost broke my no-laptop policy when this happened, but I held back - someone else would write about it. Fortunately my good friend Mattia Epifani has written some fantastic blogs about using this in the forensic realm. I highly recommend reading through these.
I spent this weekend updating and sprucing up APOLLO for its v1.0 release. It took far longer than anticipated, mostly because I’ve added quite a few new modules. It also takes a while to go through every SQL query module updating it to iOS 13. Database schemas change all the time, new tables, new columns, new everything!
I’ve done my best to test the new modules and a few of the updated older modules with iOS 13.1 and iOS 12.1.1. I have no doubts that some may work with iOS 11 as well but in order to keep on keepin’ on, I’ve decided to only test two major versions back. If you find one works for iOS 11 or older please let me know via Contact or submit a PR. If you happen to be working on an iOS 12 device I would definitely re-process for many new and updated modules! This brings the total modules to 165!
Routined Databases changed a bit in iOS 13. Cloud.sqlite is now Cloud-V2.sqlite. Most modules did not need to be updated; however a new table was introduced ‘ZRTMAPITEMMO’. Modules were updated to include this data as well as a new separate Map Item module - routined_cloud_mapitem.
In the Cache.sqlite database, a new table was introduced, ‘ZRTVISITMO’ so a new module was created for it - routined_cache_zrvisitmo.
KnowledgeC Modules
The biggest update was with my favorite database knowledgeC.db.
Update modules include more context to the Application Activity modules. Some of the iOS native applications were split out into their own (they should also be parse in the generic knowledge_app_activity module.) Note: Calendar - was its own previously, however it was renamed to knowledge_app_activity_calendar to be consistent with the new modules below.
With the APOLLO v1.0 update, I updated many of the Application Activity modules used with the knowledgeC.db database. I mentioned in this article that these were updated to provide more context to specific user application activities.
One column in particular that was added to all the App Activity modules is Z_DKAPPLICATIONACTIVITYMETADATAKEY__USERACTIVITYREQUIREDSTRING from the ZSTRUCTUREDMETADATA table. I will refer to this as “User Activity Required String” as that is what I’ve named it in the APOLLO modules.
I will start with some of the application activity parsers for the native iOS apps. The first one, Maps, is particularly difficult but holds some really interesting and useful data.
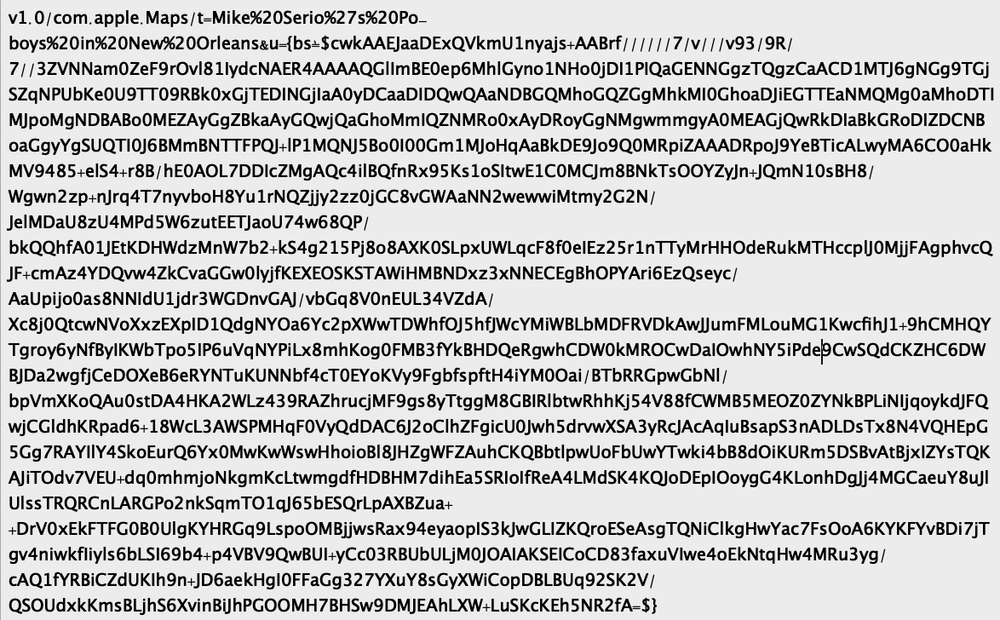
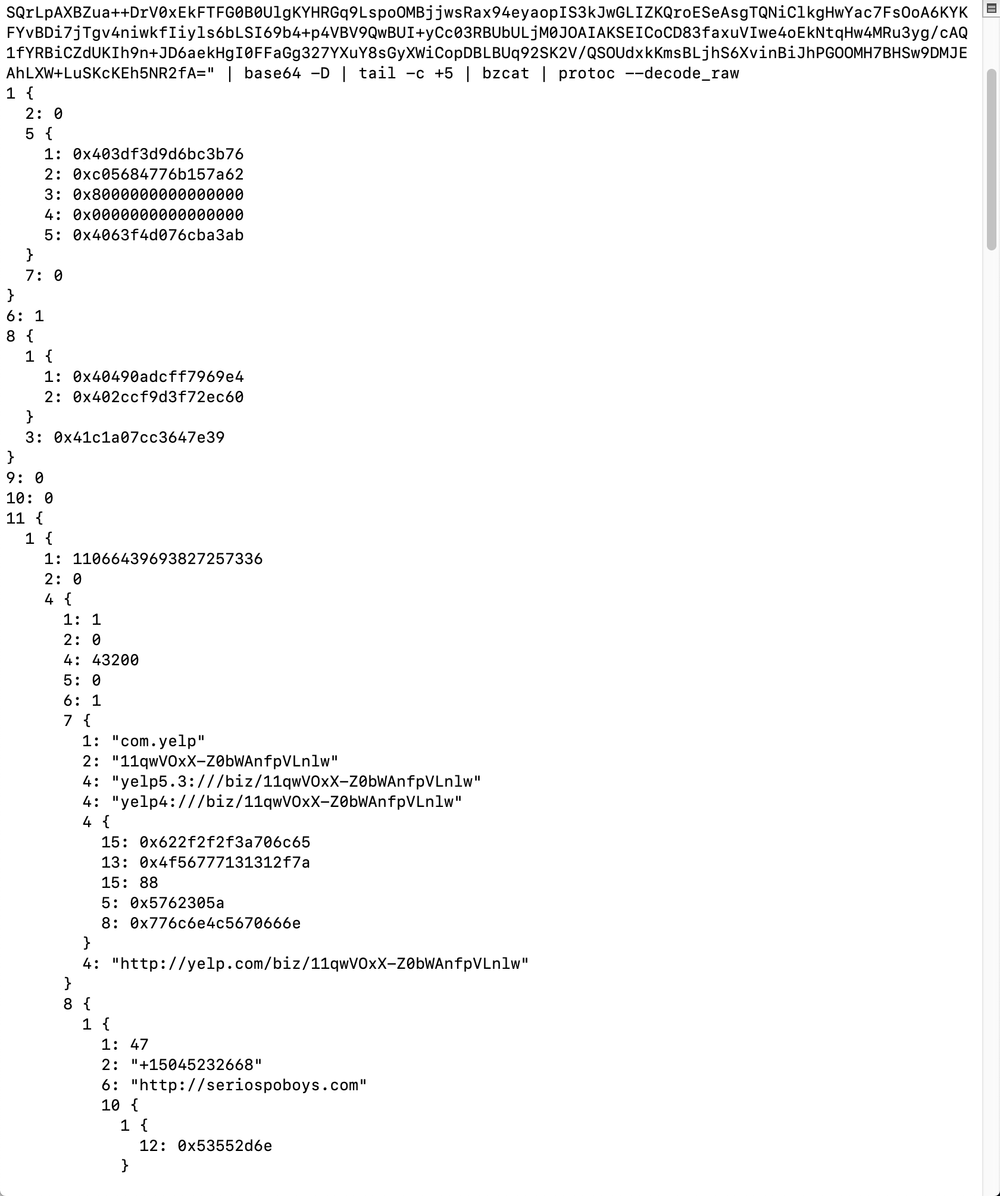
Many of the ‘User Activity Required String’ BLOBs for Maps looks more or less like the following (some are smaller, some larger.) Many investigators will recognize the base64. Whenever you are looking at an Apple device and see base64, you will want to decode it – there is usually great data in there!
You may also notice some readable text at the top of these BLOBs such as in this one. This can help provide quick context, so you can tell if you need to take the time to decode it. This example shows I searched for “Mike Serio’s Po-boys in New Orleans” while at BSidesNoLA this past October. (They were delicious.)
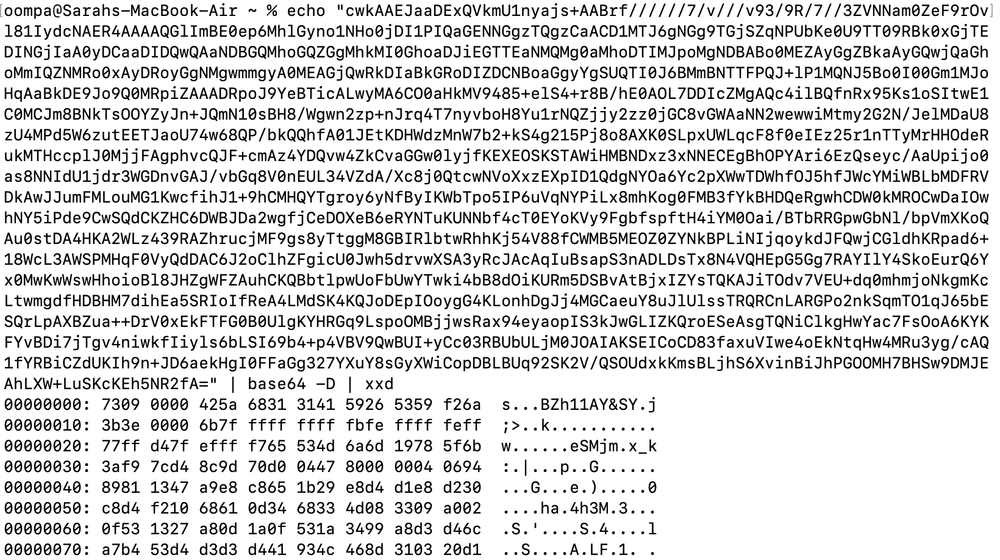
I extracted just the base64 string (between the two $ signs) and decoded it on the command line with base64 and then piped it to xxd so I could see what it was. The string ‘BZh11AY&SY’ tells me we are working with a bzip archive file.
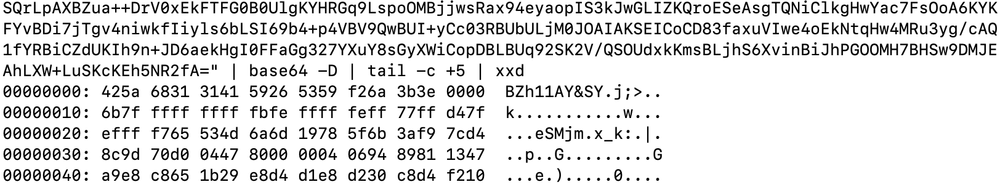
This BLOB has four extra bytes at the beginning that we need to remove before we are able to interpret the bzip archive. We can use ‘tail -c +5’ to easily remove these so we get the bzip header right at the beginning.
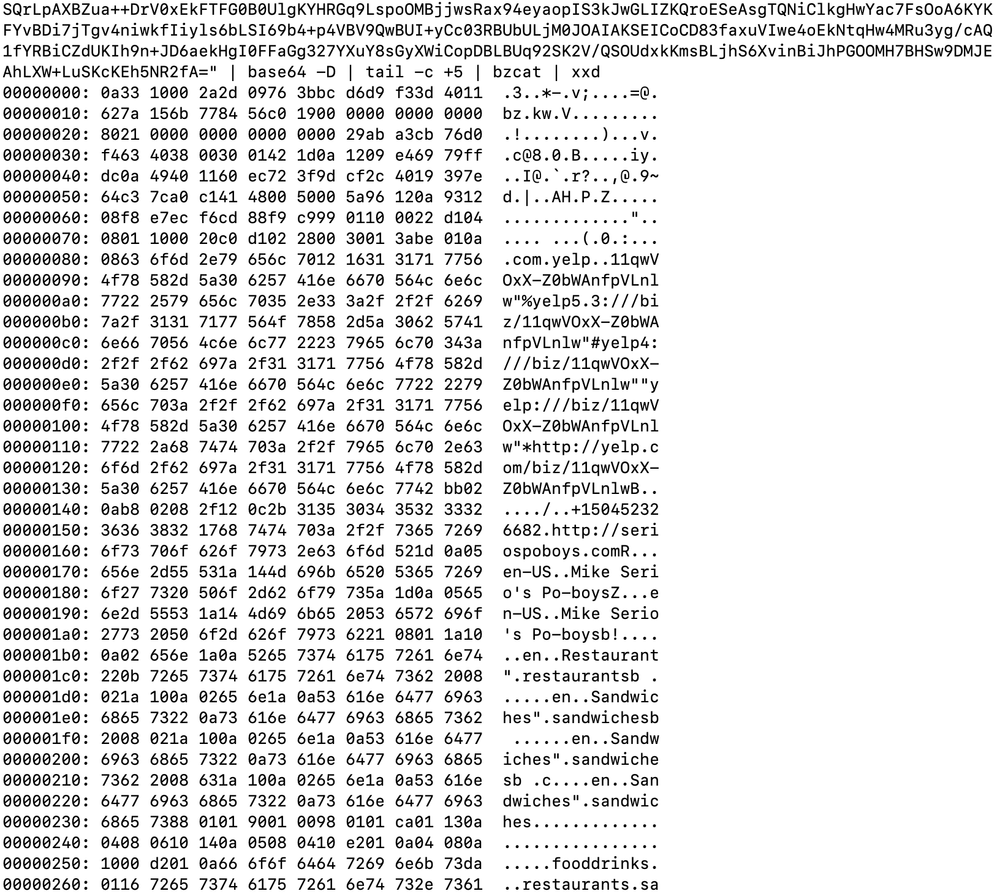
Next we will pipe this to bzcat to see what is in this archive, again using xxd last so I can see what it might be. bzcat will extract the contents of a bzip archive to standard out.
Would you look at that, we have a protobuf! I’m not surprised to see this data format; it shows up everywhere! We can parse protobufs with protoc. I will let the reader have fun determining what all is in this protobuf. Might I recommend starting with my article on Apple protobufs.
There we have it, the hoops we have to jump through to get the actual maps data. Thanks Apple, keeping it fun! Here is a quick and dirty recap of my decoding process:
Take the SQLite BLOB ➡️ Extract & Decode base64 ➡️ Remove first 4 bytes using tail ➡️ Unarchive bzip with bzcat ➡️ Decode protobuf with protoc
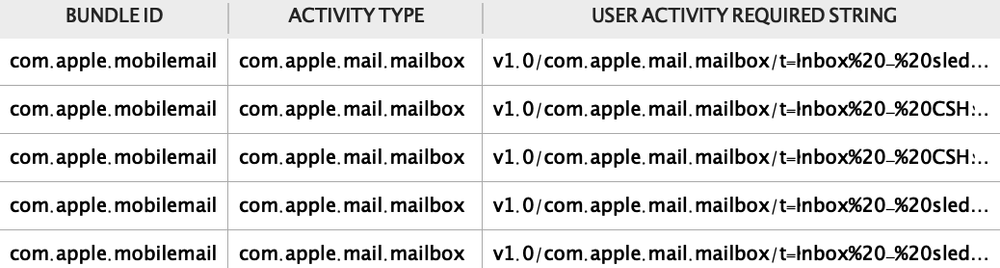
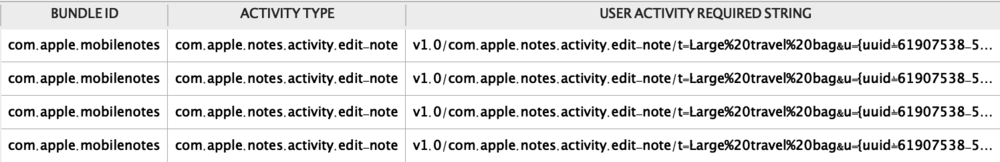
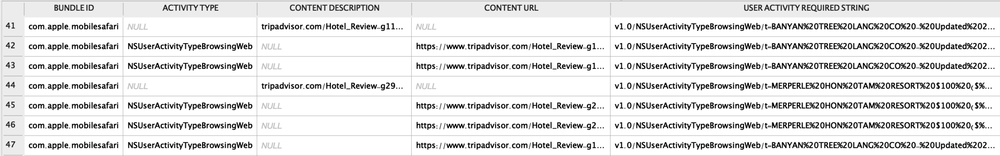
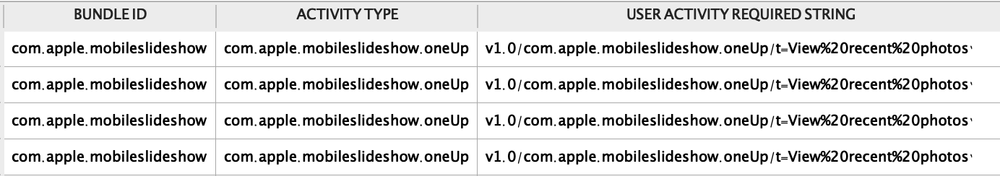
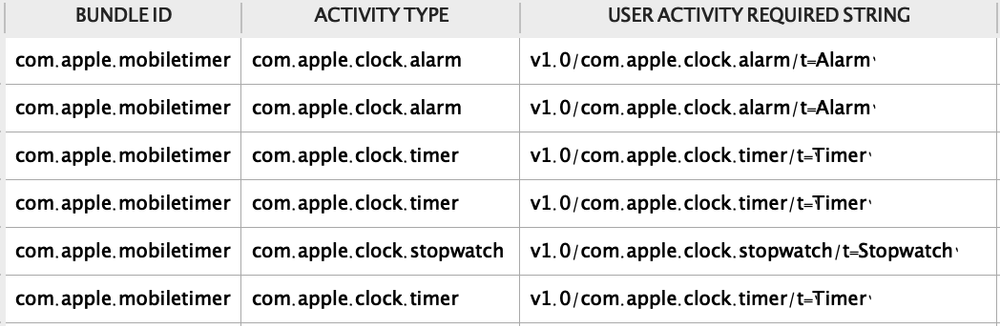
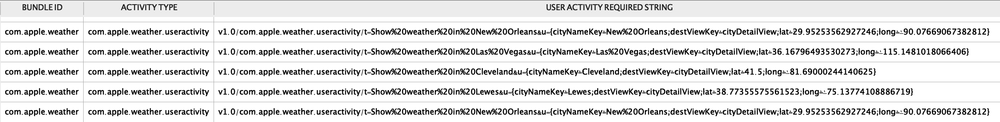
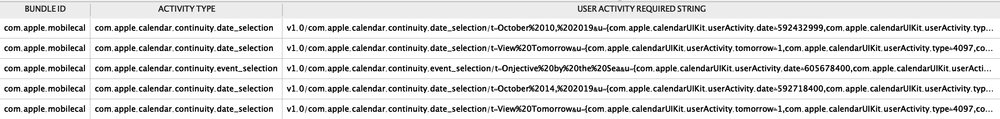
Fortunately, while fun, not all of these apps have crazy base64-bzip-protobuf blobs. Mail, Notes, Safari, Photos, Clock, Weather, and Calendar are relatively easy to visually parse and can provide context to what specifically is happening with the application. Some examples below.
Weather may be particularly interesting as it as geo location coordinates embedded. However, they might be someplace I am or am looking to go! You may want to correlate with location data extracted with APOLLO.
Now we go to the generic App Activity module to review some activities from 3rd party applications. I won’t create modules for every 3rd party application because there are so many. Some applications will have data in knowledgeC.db, some will not.
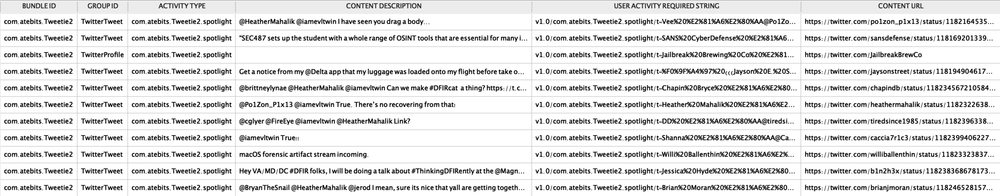
First up we have my favorite time sink, Twitter. I can see access to specific tweets as well as whichever profile pages you are Twitterstalking.
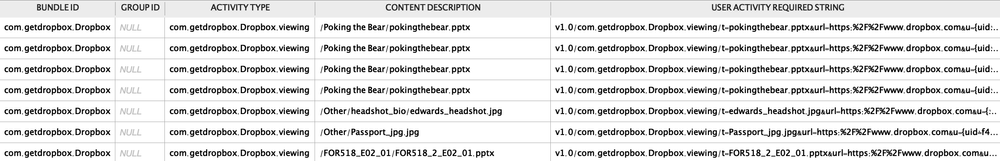
Dropbox shows access to documents with the Dropbox application.
Venmo shows me paying my debts. The User Activity Required Strings shows interesting information about the contact like their Venmo ID, how many friends they have, friend status, and their Venmo join date.
And finally, Waze shows me going “Home”.
There is some fantastic and useful information in these activities if you dive into them!
I wrote a blog for BlackBag Tech on the not so secret secrets that could be stored in secure notes using the Notes application on macOS and iOS. Note snippets, location data, and media attachment metadata can all be there for the taking!
I’ve decided to spend some time revisiting analysis of Unified Logs as blog series during this quarantine. It is the perfect topic to make bite sized and I can make it as long or as short as Coronavirus deems it so.
I’m planning of doing smaller blogs at least a couple times a week on a variety of topics such as:
Volume Analysis
User Logons
Airdrop
Network Access
GUI/Interface Items
iCloud
Continuity
Bluetooth
Backups
Software Installations
Temporal Changes
System State & Hardware
Siri
Apple Pay
HomeKit
Spotlight
Location
Unified logs will give me plenty of things to write about! Looking for something specific, run it by me!
I also plan on creating something like a reference sheet for the queries once I figure out the best place for it.
Apple introduce Unified Logging many years ago in 10.12 and has constantly been changing it since its introduction. My main problem is usually using the ‘log’ utility. It has changed over time and those changes are not documented nor is the current documentation adequate in many cases.
My most recent adventure using ‘log’ came when I was running through my course image to create a logarchive bundle from a dead system image. This particular system was running 10.13.1 and will have to be read from whatever macOS the student is running at the time. Silly me for thinking that ‘log’ would always “just work”™️.
When students upgraded to 10.14.x, they could still create the log archive via the manual process of doing a recursive copy of the /private/var/db/diagnostics and /private/var/db/uuidtext directories into a *.logarchive directory bundle. Works great! Even works (worked?) on iOS devices! On 10.14.x systems we have “force” it into the proper format but it was readable by ‘log’ and the timestamps appeared correct.
When 10.15 came out, this changed. Attempting to create and read the same data produces a corruption error. There is no option to “force” it.
I have been racking my brain and researching this on and off since Catalina was introduced. How the heck can I make this older logarchive readable using a newer versions of macOS?
Comparing the older and newer logarchive formats, they are nearly the same except for a few items. One difference I focused on was the key OSArchiveVersion in the Info.plist. On 10.14 and 10.15 they are on version 4, while on 10.13 they were on version 3. (Note: Doing a recursive copy from a dead image does not create this Info.plist file in the root of the logarchive bundle.)
In my first test, I simply added an Info.plist file to the root of the logarchive bundle with one key, OSArchiveVersion. For the value I tried 4 – why not just give it what it wants. (This testing was done on 10.15.3).
Great, it parses! However the timestamps are not quite right. I’m lucky to have a dataset that I’m familiar with and have a course labs with specific log entries and their timestamps to validate the conversion. This particular entry I’ve blogged about before – this entry should have the timestamp 2018-02-26 01:49:08.719840+0000. You can see it is only off by a smidge, what gives? These things bother me, so I decided to dive deeper.
Something else is part of this conversion. (I knew it would have been too easy to just change a plist value!)
Next, I changed the value of OSArchiveVersion to a 3. In theory, I hoped to upgrade it to version 4 but still got the same wrong timestamp. I was also not even offered the “force” option. (I really should have known it would have been too easy to just change a plist value!)
In a moment of ‘why not, let me just try this for fun’, I changed the value to 2. …and it actually WORKED! It freaking worked! I had to force it and the timestamps matched up with my original values.
I would love to know why this worked. It makes no logical sense to me.
What happens if I just go straight to version 2 for OSArchiveVersion? It also worked!
What changes in this “forced” conversion?
I created a new copy of the logarchive bundle and put the Info.plist with OSArchiveVersion = 2. Using one of my favorite file system monitoring tools, fsmon [https://github.com/nowsecure/fsmon]. I was able to monitor what the --force flag changed in the logarchive bundle.
It deletes the timesync directory (and the *.timesync file within) then creates it again with a different timesync file. Also as expected the Info.plist changes from 2 to 4.
What the heck are these timesync files? Not entirely sure, they are binary files that obviously has some sort of time syncing purpose which is why the timestamps now match up. Perhaps I will dig into these another time.
Afterthoughts
I’m not sure why 10.15 refuses to convert log archives as 10.14 did. Perhaps it is a bug, maybe it is intentional but it sure does make doing forensics difficult. I’m sure this will cause problems with newer versions of macOS as well as other platforms. I’ve heard the same problem exists with iOS, which again will likely be another blog entry when I get to testing iOS specifically.
It does however bring up a good lesson…do not implicitly trust timestamps. I’ll state this over and over until I can get people to test these things. I had it easy with this one because I had known test data – but that doesn’t work so well with random case data.
Below is the mapping of macOS version to Unified Logs Archiver versions (found in the Info.plist files while doing a ‘log collect’ command on a live system.) There are many empty spots – I have no idea if it will help or not but I tried to document it here. If you can help fill it in, I would be grateful please contact me. (Seems most folks update to the latest!)
The first item in the Unified Logs we will take a look at is a relatively simple one – evidence of the ‘sudo’ command.
In this example I’m attempting to view all the log types (including default and info) for the last day (--last 1d). The search/filter (--predicate) I’m using is looking for the ‘sudo’ process. This column highlighted in pink text.
log show --info --debug --last 1d --predicate 'process == "sudo"'
This has many entries not immediately useful to me, I can create a more specific query to filter the noise out. I’ve removed the arguments for debug and info messages as they do not appear to be needed for this query (they may for others so don’t forget about them!). To get just the entries of interest, I added a keyword search for ‘TTY=’ in the message column (eventMessage).
log show --last 1d --predicate 'process == "sudo" and eventMessage contains "TTY="'
Another technique to look at just the entries associated with a specific use of ‘sudo’ can be to filter by the Process ID (PID) by using ‘processID’. (I replaced info/debug message in the query not because its necessary but purely because its muscle memory for me to do so!)
log show --info --debug --last 1d --predicate 'processID == 26220
I tried to get a bit creative with ‘sudo’, so I incorrectly put a password in (twice) while trying to use ‘sudo -s’. I then put in the correct password. Note, I’m using the ‘last’ argument to only look at events in the last 20 minutes. Very useful if you are trying to research a certain scenario without having to scroll through millions of log entries!
log show --last 20m --info --debug --predicate 'process == "sudo" and eventMessage contains "TTY="'
While we’re here, it would be a shame not to take a quick look at ‘su’ as well. Oops, looks like I got the password wrong while doing a ‘su janedoe’ three times before finally getting it right.
I’ve changed this query a tiny bit. The process was changed to ‘su’ instead of ‘sudo’ and the keyword in the message from changed from ‘TTY=’ to ‘tty’ to capture these entries.
log show --last 20m --info --debug --predicate 'process == "su" and eventMessage contains "tty"'
Finally let’s get a query to find all the relevant ‘sudo’ and ‘su’ commands. I created a slightly more complex query that combines searching for two different processes (sudo and su) while still filtering for ‘tty’ in the message.
log show --last 20m --info --debug --predicate '(process == "su" or process == "sudo") and eventMessage contains "tty"'
To make query slicker , we can use ‘beginswith’ to just look for ‘su’ in the two processes.
log show --last 30m --info --debug --predicate 'process beginswith "su" and eventMessage contains "tty"'
And one last one, because I know you NEED to know!
Big thanks to one of my favorite comics for the classic content, these never get old! XKCD by Randall Munroe
While I’ve been researching various queries with these unified logs, I’ve noticed some peculiar but forensically useful entries. I have found many of these entries to be created when I’m browsing directories via Finder. However, they don’t appear to be logged on every directory I browse. Many of these entries also appear to be associated with particular applications/services.
This query is searching for the ‘kernel’ in the process path and ‘Sandbox’ in the sender path. To filter even further, I’ve added a keyword search for ‘file-read-xattr’ in the event message area.
This query limits the search to the last 10 minutes and during my testing these are directories I specifically browsed to within Finder. Again, I’ll note that I was able to browse to other directories using Finder but these were not logged for whatever reason.
log show --last 10m --predicate 'processImagePath contains "kernel" and senderImagePath contains "Sandbox" and eventMessage contains "file-read-xattr"'
This first example shows entries associated with the ‘garcon’ process which is associated with DropBox. I’m using TaskExplorer here from Objective-See to review information about this process.
These entries are not specific to Dropbox. Looking at my own logs, I also have entries for other applications and system services:
App Store
Microsoft Excel
Microsoft Word
MusicCacheExtens[ion] (Long process names get truncated)
TVCacheExtension
TextEdit
com.apple.CloudP[hotosConfiguration?]
mediaanalysisd
To look for the Microsoft specific entries, I added another keyword to the query to search the message area for ‘Microsoft’. This should cover all Microsoft products. While the listed directories were directories I recall browsing to, some of these documents I did not specifically open (over and over again) at these times. The application may somehow cache some of these document paths. I did in fact open these documents, just not during these particular times.
log show --predicate 'processImagePath contains "kernel" and senderImagePath contains "Sandbox" and eventMessage contains "file-read-xattr" and eventMessage contains "Microsoft"'
The last example shows TextEdit entries. This may look like I opened or accessed this Zoom chat transcript three times today (4/23/2020), but I sure didn’t. I did however open it up in the past. Again, this appears to be cached somewhere to make it appear that it has been opened.
log show --last 10h --predicate 'processImagePath contains "kernel" and senderImagePath contains "Sandbox" and eventMessage contains "file-read-xattr" and eventMessage contains "TextEdit"'
These entries certainly need to be researched further. Some entries appear to be associated with specific user interactions while others seem to be logged at random due to how an application may work. It is worth noting these entries are a log type of ‘Error’. They may not always be available. (Some are of type ‘Default’ as well).
While the timestamps may not quite match up to specific usage, these entries may still be useful in investigations to show directory contents or documents previously opened.
This week is all about system logins! On the system (via password, TouchID, or Apple Watch), local logins using Terminal, and remote logins over SSH and Screen Sharing. There are many ways of accessing a macOS system, certainly this is not all inclusive but should cover many investigative scenarios.
Let’s start with Login Window logins. These are the types of user logins that I like to call “hands-on-keyboard” at a GUI login screen. You are looking at a Mac system and log in.
The complexity of these logins has changed quite a bit over the last few years with the introduction of TouchID and Auto Login with the Apple Watch.
First, let’s review what these log entries used to look like. In reality, many of these entries still exist in these logs. Just a reminder here that there are other logs on the system that you may still need to review! These particular logs can be found in /private/var/log/system.log (and archived versions) as well as the Apple System Logs (ASL) in the /private/var/log/asl directory.
Starting with system.log and its archived versions, I’m looking for entries that contain the string “_PROCESS”. I used ‘gzcat’ to extract the messages from the gzip archives and ‘cat’ for the current system.log file.
A USER_PROCESS is a logon while DEAD_PROCESS is a logoff. These are tied together with a process ID that follows it. The facilities that record the message tell what type of login it is.
loginwindow – These are the “hands-on-keyboard” logins that I’ll be talking about in this particular post.
login – These logins are local logins, you’ll see these with each Terminal window you have open.
sessionlogoutd – Pair these with the loginwindow login entries. This is the logout.
Not shown in the screenshot is remote logins via SSH. These have the ‘sshd’ facility.
These entries don’t provide a whole lot of context. They don’t tell me which user is logging in or how (Password, TouchID, or Apple Watch)
Another log that contains similar information are the Apple System Logs (ASL). In the example, I’ve parsed these out using ‘syslog’ with a raw output format and UTC timestamps. Note I’m only showing the first three entries as these are fairly verbose. The only additional context these provide is the user logging on and where they are coming from if it is a remote login. (The raw output format is needed to see this, otherwise the output looks similar to system.log entries.)
syslog -F raw -T UTC | grep "_PROCESS"
The third place to look for these entries is the Basic Security Module (BSM) Audit trail logs. These can be parsed with ‘praudit’. A single login entry is show below, no one likes looking at these logs due to their multi-token format.
One good thing about these is that they seemed to be retained longer than system.log and ASL which has been seemingly cut down in Catalina (10.15) to about 3 days from ~7 days in system.log and ~365 days in ASL for login entries. (Oddly, the ASL Expire times are a year out as they were in previous macOS versions. 🤷🏻♀️)
These are all great places to look but we need more context. To the Unified Logs! The problem with unified logs is that they can be very verbose, just looking at my ‘loginwindow’ process entries for a day, I have about 20k! There is no way I’m going to scroll through and attempt to interpret each entry. I need to filter for specific entries. I’ve come up with a few useful queries to find specific pieces of information.
The first is looking for messages that contain ‘com.apple.sessionagent.screenIs’ string. This is going to show if the system is locked or unlocked, and which user is currently logged in with their user ID (UID). These are not technically logins since the user is already logged in but are useful for telling if the screen is locked or not
com.apple.sessionagent.screenIsLocked = Screen is Locked
com.apple.sessionagent.screenIsUnlocked = Screen is Unlocked
log show --predicate 'eventMessage contains "com.apple.sessionagent.screenIs"'
To determine when the user did a true login (versus just a screen unlock) we can look for com.apple.sessionDidLogin in the message while specifically looking at the ‘loginwindow’ process.
log show --predicate 'processImagePath contains "loginwindow" and eventMessage contains "com.apple.sessionDidLogin"'
I really like the messages associated with ‘SessionAgentNotificationCenter’. They are easy to interpret which is why I chose them for these examples. I created a broader query to get more details about these login sessions to include the following entries:
com.apple.system.loginwindow.shutdownInitiated – User chose to shutdown system
com.apple.system.loginwindow.logoutcancelled – User canceled the shutdown (or restart or logoff)
com.apple.system.loginwindow.restartinitiated – User chose to restart system
log show --predicate 'eventMessage contains "com.apple.system.loginwindow" and eventMessage contains "SessionAgentNotificationCenter"'
You might notice a couple UID’s in these examples (501 and 502). This is me going back and forth between accounts using Fast User Switching which can be filtered for by using ‘com.apple.fastUserSwitchBegin’.
Keeping track of what we have so far using ‘SessionAgentNotificationCenter’
Screen Lock/Unlock Status
User Logons
User Logoff
Restarts (w/UID)
Shutdown (w/UID)
Fast User Switching
Canceled Restart/Shutdown/Logoff
To get all these ‘SessionAgentNotificationCenter’ messages try using this query:
log show --predicate 'eventMessage contains "SessionAgentNotificationCenter"'
Password, TouchID, or Apple Watch?
So many loginwindow logins but which type! Is it a normal password login, using TouchID, or Auto Unlock using their Apple Watch? I find the messages that contain ‘LWScreenLockAuthentication’ are good for this. I’ve also added the strings ‘| Verifying’ and ‘| Using’ to filter it further.
log show --predicate 'eventMessage contains "LWScreenLockAuthentication" and (eventMessage contains "| Verifying" or eventMessage contains "| Using")'
The screenshot above contains the three different types of logins.
Regular Password:
“Verifying using PAM configuration screensaver”
TouchID:
“Using localAuthentication hints”
“Using hint-provided username oompa”
“Verifying using PAM configuration screensaver_la”
Auto Unlock with Apple Watch:
“Using continuity hints”
“Using hint-provided username oompa”
“Verifying using PAM configuration screensaver_aks”
To get more detail I want to look at messages for ‘LWDefaultScreenLockUI’. I’ve combined these entries together in a long query looking for specific keywords.
log show --predicate 'eventMessage contains "LWDefaultScreenLockUI" and (eventMessage contains "authSuccess" or eventMessage contains "authFailWithMessage" or eventMessage contains "loginPressed" or eventMessage contains "authBegan" or eventMessage contains "preLoad")'
The keyword ‘preload’ provides us some metadata about the system.
fmmEnabled – Find my Mac is Enabled
fusEnabled – Fast User Switching is Enabled
The number of user accounts are on the system
The next set shows if the login was successful or not.
loginPressed – Password Attempt Number (Attempt #: ?)
If someone is attempting to brute force via typing in passwords you’ll see the number of attempts tick up.
authBegan – Begin Authentication
authFailWithMessage – Authentication Failed
authSuccess – Authentication Successful
I bet you thought login entries would be easy! Coming up this week are local logins and remote logins via SSH and Screen Sharing.
Local logins are created when an already logged in user opens a Terminal window. Each terminal window is a separate ‘login’ process. If you have six Terminal windows (or tabs) open, you have six ‘login’ processes.
In the last article, I showed how you can find these processes using other log types. Let’s see what local logins look like in unified logs. Trying to create a query from these, I ran into an issue trying to filter for the ‘login’ process which makes a great learning example.
If I try to use ‘processImagePath’ I get lots of unnecessary entries from ‘loginwindow’ or any other process that might have ‘login’ in the name. This is because the process that we see in the default ‘log’ output is actually part of a path as the field ‘processImagePath’ suggests.
log show --predicate 'processImagePath contains "login"'
We can use a different output style to see these paths. I used JSON for the output in the screenshot below.
log show --predicate 'process contains "login"' --style json
To filter specifically for the ‘login’ process, I will use ‘process’ instead of ‘processImagePath’ which will just filter on the process name. As an example, I changed ‘contains’ to ‘=’ in the first command line to show it is looking for just the term ‘login’. This shows no results due to using ‘processImagePath’ instead of ‘process’.
log show --predicate 'process = "login"'
Getting back to those ‘login’ processes, I created the query below. While not perfect it does show some interesting items.
log show --info --predicate '(processImagePath contains "opendirectory" and eventMessage contains "Client:") or process = "login"'
In this test, I just opened a new tab in Terminal and performed a few commands.
The query output shows the ‘login’ process as well as a few ‘open directory’ entries. Not all of these are related to this Terminal action, but these can be visually filtered out by using process IDs (40881, 40882). While this does show a new Terminal window opening via the ‘login’ process we also see the exiting action for ‘zsh’ and ‘login’.
Unfortunately, I have found that these particular ‘opendirectoryd’ processes will expire in a very short time period (~90 minutes) therefore I might revert back to other logs to extract this information as show in this syslog output.
Can you really have ‘login’ inception? Yes! (I’m using the ‘login’ command here to login to various user accounts in the same shell. 🤪)
I’m sure many of us are working remote right now possibly using some of these remote capabilities. Remote Logins can include a few different services; SSH and Screen Sharing are two that I’ll show here. These services are disabled by default and would need to be turned on in the user’s Sharing preferences.
When Remote Login is turned on in the Sharing preferences, the system will have an SSH server enabled. Let’s take a look at what an incoming SSH connection might look like first for a user account on the system that does not have this option turned on (janedoe). We are looking for the entries for the process ‘sshd’.
log show --predicate 'process = "sshd"'
One entry to key in on is the “user account has expired”. A user attempted to use SSH to login to this system using the ‘janedoe’ account coming from IP 192.168.1.170, however the connection failed.
Now on a system that does have remote login turned on. This first example shows an incorrect password attempt.
And a correct password attempt and login.
Connections can of course be incoming or outgoing. If the user were trying to access another system it might look like this. Not a whole lot unfortunately.
log show --info --predicate 'process = "ssh" or eventMessage contains "ssh"'
…and when the connection closes.
Screen Sharing is another service that needs to be explicitly enabled in the Sharing preferences. Incoming connections will show the user who logged in and where they came from. The example below shows an incorrect password that failed, and another that was correct. I’ve only queried for messages that contain the text ‘Authentication:’. Looking for all messages associated with the ‘screensharingd’ process will be quite verbose with some metadata about the session.
log show --predicate 'process = "screensharingd" and eventMessage contains "Authentication:"'
Outgoing connections, like incoming connections, can be verbose. The process is ‘Screen Sharing’ like the application name.
log show --info --predicate 'process = "Screen Sharing"'
I might do a specific filter for ‘connect’ and ‘disconnect’ in the messages to see multiple sessions over time.
There are many output styles options for the ‘log’ command. Sometimes the default output may not get you what you want. This article will walk through the various log output styles looking for USB Mass Storage Class devices using the keyword ‘USBMSC ‘. These devices may include thumb drives and external hard drives as long as they are considered Mass Storage Class devices.
These entries get created when they are inserted into macOS systems. The output of these entries includes:
The “non-unique” identifiers – usually the serial number of the device, but as it suggests it may not necessarily be unique.
Vendor ID
Product ID
Version
Using --style we can change the output to something that is perhaps more appropriate. This can also be a personal preference. The output styles are listed in the ‘man’ page.
In the query below, I am searching my logs for these types of devices with the ‘default’ output option. I’m looking for the string ‘USBMSC’ in the event messages.
log show --predicate "eventMessage contains 'USBMSC'"
The default output contains quite a few columns:
Timestamp (with microseconds and time zone)
Thread ID
Log Type
Activity ID
Process ID
TTL
Process
Subsystem
Category
Message
Other than the ‘default’ style, we will need to specific the style we want with --style. First up in ‘compact’.
log show --predicate "eventMessage contains 'USBMSC'" --style compact
The compact option removes the Activity ID and TTL from the ‘default’ output while compressing other fields.
Timestamp (with milliseconds and no time zone)
Log Type (abbreviated)
Process
Process ID
Thread ID
Subsystem
Category
Message
The next couple of log output styles is ‘json’ and ‘ndjson’. The first being json with whitespace, while the second is a single line for each entry. I’ve highlighted each entry to better show the structure in these two examples. I like how the json output shows the full paths for senderImagePath and processImagePath. It also shows a quite a few additional fields. Not exactly human-readable for more than a few entries, but this could be imported into another viewer or pumped through scripting utilities.
log show --predicate "eventMessage contains 'USBMSC'" --style json
log show --predicate "eventMessage contains 'USBMSC'" --style ndjson
One thing I miss with this JSON output is the colorization. While there is a --color argument in ‘log’, it doesn’t seem to apply to JSON style output. However, I can use the tried and trusted ‘jq’ command line JSON parser here.
The last output example is ‘syslog’. If you’ve been looking at Apple System Logs (ASL) or other syslog style logs, you might prefer this output format.
log show --predicate "eventMessage contains 'USBMSC'" --style syslog
This style is useful if you need an even more compact view than using the ‘compact’ style. Again, the colorization is removed from these entries (--color doesn’t appear to work here either).
I’ll walk you through using BlackLight’s APOLLO plugin to track user application usage (knowledgeC, Power Log and Screen Time), device states, network usage and processes, file quarantine, and application permissions (TCC) on macOS.
A quick trick to get more info when you are testing different Unified log examples is to use Terminal’s man page lookup feature. This is useful to provide more context to processes that you may not be familiar with. Perhaps you have something interesting in the eventMessage field and want to know more about what processes use that information.
In this example, I “right-clicked” some of the process names to get more information about them; sharingd, bluetoothd, and powerd. However, identifityservicesd does not have a man page so I’ll have to research that one another way!
We’ve been trapped inside our homes for months. We’ve reached the end of Netflix, listened to everything on Apple Music, watched old vacation videos trying to remember what travel was like, and mindlessly browsed YouTube videos. All these actions have been recorded in your unified logs!
I came across this one while researching another topic and thought it might be useful and a quick write-up. Turns out it wasn’t as quick as I had hoped – so many different scenarios to test! I’d still like to dig into this one a bit more as it can be quirky as noted in the last section. While sometimes odd, I think this information can provide insight into what media a user is viewing on their systems - not just macOS, but iOS as well.
The query below will show information related to media that is “Now Playing”, not just on the computer that the logs came from, but also potentially other AirPlay connected devices. There will be many entries but we will only focus some in this article.
log show --predicate 'category = "MediaRemote"'
Movie time in the Photos.app
Gather the family and start reminiscing over vacation videos. You might bring up Photos.app and search for various videos that you were going to show all your friends and family (and never actually did, but you just HAD to get that video.)
In the screenshot below, the ‘MediaRemote’ is what we are filtering on in the query above (highlighted in yellow).
Various pieces of data get recorded in the unified logs. In many entries you should see the bundle id or application name being used – in this example Photos or com.apple.photos. A good keyword to look for is “client-“ before the bundle id for the app.
You can also see two sections that contain media metadata that includes:
Media Duration (in seconds)
Elapsed Time – We can use this to determine how long it was viewed/listened to.
Item Identifier (GUID) – This GUID changes over the period of viewing so not a great filter for a specific file. It will change if media is stopped, paused, etc.
File Path & Name
This video is 10 seconds long, using the elapsedTime entry we can see that it was played all the way though.
The file path is in the user’s Photos Library package directory which is not surprising. This filename however, is not the original filename of this video. We can use ‘xattr -p’ to print the extended attribute that contains this data (com.apple.assetsd.originalFilename). Using the original file name IMG_3586.MOV we might be able to do a search across the system to find other artifacts of its use and more metadata in the Photos.sqlite database including a running count of how many times it was played.
MOV Files in QuickTime
Maybe you don’t use Photos.app, instead you downloaded the movie to your macOS system and viewed it using QuickTime player (com.apple.QuickTimePlayerX). Many of the same metadata pieces are still there but the filename might look strange to you. This is a good example of a “File Reference URL”. This is the same video I used as the example above. I exported it out of Photos using the original filename, IMG_3586.MOV and saved in the Downloads directory.
In the screenshot above the elapsed time is 00:00:00, and duration is 00:00:10 (10 seconds). Below, the elapsed time is 00:00:05 (5 seconds, actually closer to 6 if we round up.). I started the video, watched ~5 seconds and played out the rest of the video (these additional entries are not shown.) The playback rate entry appears to be a 1 while playing and a 0 while stopped/paused. A GIF of this action was recorded below. Featuring a playful elephant at the Taronga Zoo in Sydney.
Getting back to that “File Reference URL”, you probably want to find the original file as part of an investigation. We can use the inode section of the URL to find it. In this example I renamed IMG_3586.MOV to elephants.mov. Most forensic tools should be able to query for a file system inode number. Inode numbers do not change when a file gets renamed.
Finding a sense of calm with Music.app
I queued up a new album by one of my favorite classical musicians, Ludovico Einaudi. An Italian, who created this album while in quarantine at his home in Italy. The album includes 12 songs, and one video (not shown in the screenshot.)
We can see the queue count for Music (com.apple.Music). While I listen to this album, it will tick down, one-by-one.
Finding the End of the Internet
To get a few laughs, I used Safari browser to watch clips of Archer on YouTube. Safari is not listed as the application, but com.apple.WebKit.WebContent is – this is a signature of Safari WebKit being used. Surrounding entries (not shown) will show hints that Safari.app is being used as this time.
In Chrome, I went to watch videos on the BBC and found this excellent video of a dog who helps rescue Koalas in Australia (running theme? 🤔). We can see the Google Chrome (com.google.Chrome) app is being used, but it may not necessarily state the website. You may have to determine this using other user activity artifacts (browsing history!).
What about AirPlay?
The media examples above were all viewed on a local macOS system, what would it look like if I used my extensive Apple ecosystem of devices? Might as well use these devices for “research”, right?
While doing this research, I was watching one of my favorite older television shows, Alias using Amazon Prime Video (com.amazon.aiv.AIVApp) on one of my Apple TVs. Every episode that it would run though would show entries on my Mac. My Mac had nothing to do with my binge watching, but the entries were recorded anyway…cool! I should note that if the system is not being used (laptop shut), these entries do not appear in my logs. The Apple TV is named ‘Living Room’.
Of course, I also have a HomePod and stream music and news to it all day long. In this example I’m streaming from my macOS laptop to my HomePod named StationX. I have found that the elapsed time doesn’t seem to update as the examples above did.
Quirky? Yes.
While doing this research and testing various applications, I came across entries while I was most definitely sleeping. Seems my laptop wanted me to listen to the radio very, very early in the morning for about 15 seconds. 🤷🏻♀️
Do entries like this make all the examples in the article inaccurate? Absolutely not. Computers act in weird ways. This is a great example of why correlating this information to user activity through other means (ie: sleep status, device unlocks, user activity in knowledge, etc.) is required in investigations.
I hope this article gets you thinking about all the other apps that you watch media from. Again, this is not just on macOS but also on iOS (and likely tvOS as well). All those applications, native and 3rd party, are just waiting to catch you binge watching your favorite show, finding the end of YouTube, and rocking out to your favorite 90’s boyband jams!
TCC or Transparency, Consent, and Control keeps track of various application permissions. A user can make changes to an application’s permissions in the respective Privacy settings on macOS and iOS.
When changing these permissions on macOS entries do get written into the unified logs. While there are many related TCC entries, I want to focus on just permission changes. These can be extracted using a query where I’m looking for the text ‘Update Access Record:’ in the log message.
log show --info --predicate 'eventMessage contains[c] "Update Access Record:"'
To create these entries, I went into my own settings and toggled some on (Allowed) and some off (Denied).
Camera access was denied to QuickTime Player (com.apple.QuicktimePlayerX)
Camera access was allowed for Zoom (us.zoom.xos)
Microphone access was denied to PowerPoint (com.microsoft.Powerpoint)
Microphone access was denied for SnagIt (com.TechSmith.Snagit2020)
Accessibility access was denied for SnagIt (com.TechSmith.Snagit2020)
Accessibility access was allowed for iStat Menus (com.bjango.istatmenus)
Accessibility access was allowed for SnagIt (com.TechSmith.Snagit2020)
Unfortunately, these entries are removed from the logs after in a short time period. I’ve seen mine being removed anywhere from about 1 hour to 1h40m. 😧
iOS TCC Entries
On iOS many of the same privacy settings apply as well. In this example I toggled the WhatsApp permission for microphone access to on.
I’ve connected to my phone using the Console.app application on macOS. This particular phone is named miPhoneX (iPhone X running iOS 13.1). This is the easiest way to test certain scenarios on iOS devices, sadly there doesn’t appear to be a ‘log’ executable for jailbroken devices. Unified logs can also be extracted using sysdiagnose or copying them off a jailbroken device and manually creating a logarchive.
Toggling permissions back and forth I can see the same entries I might see on macOS, however notice the ‘Volatile’ column for these entries are set to a ‘1’ – meaning they are not being written to disk. These entries are removed after only a few minutes (less than 5 minutes in my experience). What you see in Console may not necessarily get written to disk. Some entries (like those for macOS) are written to disk but not necessarily kept for the entirety of unified logs themselves. Nothing lives forever!
macOS & iOS TCC APOLLO Module
There may be a time when the macOS logs rollover or you are looking at an iOS device where these entries are volatile. Fortunately, the TCC.db database keeps track of the last modified time for these entries. I’ve created an APOLLO module for macOS and iOS to extract this information. The example below is from my macOS user TCC.db database using the SQLite query from the APOLLO module.
This database can be found on macOS and iOS devices in the following paths:
The DFIR Twitter-sphere exploded this morning when @mattiaep mentioned /private/var/mobile/Library/PersonalizationPortrait/PPSQLDatabase.db. I’ve been doing some research work on this file and plan to present pieces of it during my talk at the upcoming SANS DFIR Summit. I reached out to @iamevltwin and asked if she would host a quick blog post and she graciously agreed - but I now owe her gin, and steak and cheese egg rolls. In all seriousness, a huge thank you to my good friend and mentor!
The PersonalizationPortrait directory is native on iOS 13 and contains a few interesting files. One specifically, PPSQLDatabase.db, is loaded with data. From my research, the directory existed on iOS 12 but this database did not. Some of the data is repetitive from other native locations, but there’s a lot of context that can be correlated from this database and pieces of this data might exist longer here than they do in other places. So what is the purpose of this database? Don’t forget as you poke at it, that it has ‘Personalization’ in its title. It resides in the native /Library directory, so it’s Apple. What are you up to Apple?
My research on this is still ongoing, but one thing I know is Apple wants me to like my device and to feel comfortable while I’m constantly immersed in their operating system. When I open News I want to see certain things of interest. When I select a photo to send to a friend Apple gives me a short list of probable recipients. When I plug my car into CarPlay I appreciate when Apple weirdly predicts where I’m headed. Is this ‘Personalization’ just for Apple or are pieces of this filtering out to other parties for better advertisement tailoring? The Widgets screen to the left of my home screen on my iPhone is a dynamic representation of so many pieces of personal data. What’s next on my Calendar and where it’s occurring, which apps I recently used, News, Weather based on my location, where I last parked my car when using CarPlay, and ScreenTime totals I can’t hardly believe.
I want to highlight a few pieces of the PPSQLDatabase.db file to show it’s potential, and pass along an appropriate amount of caution as well. This database is aggregating data from many sources and attribution must be done carefully.
The first table to peek into is loc_records. It is absolutely loaded with location data - mine had 1000 entries. The 1000 is curious, and I wonder if anyone else’s table is limited at 1000 or if mine just landed on that nice even number. @iamevltwin did a quick check and found 1000 as well on Mac and iOS, so it seems that is the limit for the table. In reviewing just the locations from this table without joining any other table data, I quickly recognize many of them as places I have definitely been with this device in my pocket. But…then there are those locations I definitely haven’t been, ever. So while having 1000 locations records to play with sounds like good fun, don’t forget to be diligent with attribution.
Most of these location records have a column named “clp_location” which is stored as BLOB data. At closer inspection the BLOB data is a binary plist (.bplist).
Using plutil -p produces a more friendly output format to inspect, reminiscent of Cloud-V2.sqlite and other “Significant Location” files. But that doesn’t mean my device was at that place at that time, because I wasn’t in Las Vegas on June 2nd, 2020 which is what that timestamp converts to. I checked my photos based on the ‘Places’ feature, and I did take a photo at that location - but it was June 4th, 2019 at 5:35PM. Weird.
So why is a photo from a year ago popping up? Making a few joins and gathering a bit more data produces more context to this specific item. After hammering out a query to join it over to the ‘sources’ table, I am able to see that this entry is associated with ‘com.apple.mobileslideshow’ and more specifically ‘com.apple.proactive.PersonalizationPortrait.PhotosGraphDonation’. One word really jumps out there - ‘proactive.’ That makes me think Apple is doing something for me here, and without asking. I went to my Photos section and found a categorization of Las Vegas photos for June 2-7 in my ‘Months’ category, and the photo is in that album. As I scanned the other places in these ‘proactive’ listings I am also able to see photo groupings from a trip to Jamaica (Kingston) and to Huntington Beach, CA in their own categories.
So you may be asking yourself at this point, “Why did I just read this? It’s a location in a photo.” Stick with me, and remember we are trying to figure out what this newly discovered file is doing and how far reaching it might be.
A few lines down from the photos we have an address in New Jersey being attributed to com.apple.mobilemail. I tweaked the query to ‘localtime’ for the sake of presentation, but I received an email on May 31, 2020 at 11:17AM EDT regarding the June 2nd release of Cellebrite Physical Analyzer version 7.34. In the signature of that email was the US headquarters address for Cellebrite - 7 Campus Drive, Suite 210, Parsippany, NJ.
This is just scratching the surface of a few items from one table with basic table joins made. Scanning other bundles represented here I can see some of my favorite places from Apple Maps, locations recently mentioned in iMessage conversations, and Calendar records of my standing 12:30PM Zoom meeting for Life has No Ctrl+Alt+Del.
If you don’t have time to research but would like to hear more about it, tune in to my talk at the SANS DFIR Summit on July 16th! If you do, try out this query I used for this blog post to pry around at this one table from this database and let me know how it works on your data via Twitter @bizzybarney.
select
loc_records.id,
sources.bundle_id as "Bundle ID",
sources.group_id as "Group ID",
datetime(sources.seconds_from_1970, 'unixepoch') as "Source Time",
loc_records.cll_latitude_degrees || ", "|| loc_records.cll_longitude_degrees as "Coordinates",
loc_records.clp_name as "Name",
loc_records.clp_thoroughfare as "Road",
loc_records.clp_subThoroughfare as "Address #",
loc_records.clp_locality as "City",
loc_records.clp_subLocality as "Sub-locality",
loc_records.clp_administrativeArea as "Admin Area",
loc_records.clp_subAdministrativeArea as "Sub Admin Area",
loc_records.clp_postalCode as "Postal Code",
loc_records.clp_ISOcountryCode as "Country Code",
loc_records.clp_country as "Counrty",
hex (loc_records.clp_location) as "Location BLOB (hex)",
loc_records.extraction_os_build as "iOS Build Version",
loc_records.category as "Category",
loc_records.algorithm as "Algorithm",
loc_records.initial_score as "Initial Score",
CASE
WHEN loc_records.is_sync_eligible = 1 then "Yes"
WHEN loc_records.is_sync_eligible = 0 then "No"
end as "Sync Eligible"
from loc_records
left join sources on loc_records.source_id=sources.id